The Missoula Real Estate Guide features thousands of pages of the very latest real estate listings and homes for sale in Missoula and Western Montana
by Mindy & Steve Palmer. Not your ordinary Missoula real estate agents.

All posts tagged Market Reports

2026 Five Valleys Housing Report
Section-by-section summary | Missoula Organization of REALTORS® (MOR)
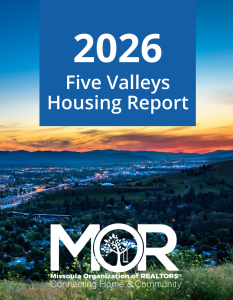
 

Missoula Housing Report CoverThe 2026 Five Valleys Housing Report examines Missoula’s residential real estate market using primarily 2025 data, covering home sales, prices, affordability, housing inventory, new construction, population trends, and rental housing. Its central conclusion is that the Missoula housing market is continuing to stabilize, with increasing inventory, modestly declining prices, and improving sales activity, although affordability remains a significant challenge.


Missoula Housing Continuum
The Missoula housing continuum illustrates the range of housing options available to residents, from emergency shelter and supportive housing to market-rate rentals and homeownership. The continuum distinguishes between housing requiring public or nonprofit support and housing that is financially self-sustaining. Intermediate options include nonprofit rentals, subsidized market-rate rentals, and conditional pathways to homeownership, such as community land trusts and deed-restricted housing. The framework emphasizes that a healthy housing market requires a variety of housing types to accommodate residents with different incomes and circumstances.


Missoula Five Valleys Geographic Areas
The report distinguishes between two geographic areas used for housing analysis: the Missoula Urban Area, which provides the basis for residential sales statistics, and the broader Missoula County Planning Areas, which are used to examine housing supply, subdivision activity, and development trends. The planning areas encompass Missoula and surrounding communities, including Lolo, Seeley-Swan, Potomac-Greenough, Bonner-Milltown, and other outlying areas. Understanding these geographic distinctions is important because housing prices, inventory, and development activity can differ substantially between neighborhoods and surrounding rural communities.


Missoula Urban Area Sales
Missoula’s residential real estate market experienced a modest decline in median sales prices during 2025 while total transactions increased. The median sale price decreased from $562,400 in 2024 to $550,000 in 2025, a reduction of approximately 2.2%. Meanwhile, the number of residential sales increased from 984 to 1,029, representing a 4.6% increase and the second consecutive year of improving sales volume. Despite this recent price moderation, the median home price remains approximately 57% higher than in 2020, when it was $350,000. These trends suggest that the market is gradually adjusting following several years of rapid appreciation, with improving transaction activity but home prices remaining historically elevated.


Sales Volume by Neighborhood
Housing market conditions varied across Missoula neighborhoods during 2025, although a general relationship emerged between changes in median sales prices and transaction volumes. Neighborhoods experiencing price declines generally recorded increased sales, while areas with rising prices tended to experience fewer transactions. In Lolo, for example, the median sales price declined slightly from $555,000 to $550,000 while sales increased from 45 to 59. In the Lewis & Clark neighborhood, median prices dropped from $610,000 to $550,000 while transactions increased from 21 to 23. Conversely, Grant Creek/Butler Creek experienced an increase in median prices from $764,440 to $775,000 while sales declined from 36 to 27. These patterns suggest buyers are responding to price adjustments, although conditions remain highly localized.


Percentage of Sales by Financing Method
Conventional mortgages remained the dominant financing method for Missoula-area home purchases in 2025, followed by cash transactions, with FHA, VA, USDA, and other financing programs accounting for smaller shares. One particularly noteworthy trend was the increasing prevalence and value of seller concessions, which can help purchasers offset closing costs, mortgage-rate buydowns, or other transaction expenses. The percentage of sales involving seller concessions increased from 44% in 2024 to 46% in 2025, while the median concession increased substantially from $5,275 to $8,000. This trend suggests sellers are becoming more willing to negotiate and provide financial incentives, another indication of a market shifting toward more balanced conditions.


Housing Affordability Index
Housing affordability improved in Missoula during 2025 but remains a significant obstacle for many households. The Housing Affordability Index increased to 65 for buyers making a 5% down payment and 82 for those making a 20% down payment, compared with 52 and 62, respectively, in 2024. These improvements reflect a combination of lower mortgage interest rates, slightly lower median home prices, and higher median family income, which increased to $106,100. Nevertheless, purchasing a median-priced $550,000 home still required estimated monthly housing payments of $4,092 with 5% down or $3,235 with 20% down, including principal, interest, taxes, and insurance. Both affordability indexes remain below 100, indicating that the median-income family cannot comfortably afford the median-priced home under the report’s affordability assumptions.


Market Supply
The report evaluates residential housing inventory using the absorption rate, which estimates how many months it would take to sell the available homes at the current pace of sales. An inventory level below three months indicates an undersupplied market, while three to nine months represents a normal market. Missoula’s housing supply has gradually improved from the exceptionally tight conditions experienced during the pandemic-era housing boom, although inventory remains relatively constrained. By late 2025, the overall market was operating near the lower end of the normal inventory range. Increasing supply is contributing to greater buyer choice, more opportunities for negotiation, and reduced upward pressure on home prices.


Market Supply by Neighborhood
Housing inventory varied considerably among Missoula neighborhoods at the end of 2025, creating distinctly different conditions for buyers and sellers. The Lewis & Clark neighborhood had approximately one month of inventory, indicating a strong seller’s market, while Lolo had 2.5 months and Southgate had three months. Lower Miller Creek had 4.29 months of supply, while Franklin to the Fort had 5.6 months, both within the normal inventory range. By contrast, the Sx͏ʷtpqyen/Mullan area had approximately 10.1 months of inventory, indicating an oversupplied market relative to other neighborhoods. These differences demonstrate that broad market trends do not necessarily reflect conditions within individual neighborhoods and that local inventory is an important consideration when pricing or purchasing property.


Missoula County Planning Areas: Supply by Price Range
The distribution of available homes by price range reveals an imbalance between more affordable housing and higher-priced properties. As of December 31, 2025, the report identified 490 active residential listings, representing approximately 5.27 months of total inventory. Supply was particularly limited in the $300,001–$600,000 range, where absorption rates were approximately 3.05–3.56 months and the number of available listings fell substantially below theoretical normal market levels. In contrast, homes priced above $1 million had approximately 17.83 months of inventory, representing a substantial oversupply. This disparity highlights a fundamental challenge in the Missoula housing market: available inventory is not necessarily concentrated in the price ranges where housing demand is greatest.


Subdivision Approvals
Subdivision approvals provide insight into the potential future supply of residential building lots throughout Missoula and surrounding areas. The report distinguishes between preliminary plat approval, which establishes the conditions a developer must satisfy, and final plat approval, which certifies those conditions have been met and allows development to move toward permitting and construction. The accompanying charts illustrate substantial fluctuations in subdivision activity over time, including recent increases in preliminary approvals within the City of Missoula. However, preliminary approvals do not immediately translate into buildable lots or completed homes. The difference between preliminary and final approvals emphasizes that infrastructure requirements, financing, development costs, and regulatory processes can delay the delivery of new housing.


Residential Building Permits Issued
Residential building permit activity provides another measure of the housing construction pipeline in Missoula County. Through the fourth quarter of 2025, the City of Missoula issued 587 residential building permits, compared with 337 in the unincorporated portions of Missoula County, based on the report’s combined housing-type categories. The historical data show considerable volatility in city permit activity, including a pronounced spike earlier in the decade, while permits in the unincorporated county generally increased more gradually. Continued construction activity is important for addressing long-term housing demand, but the number of permits issued does not necessarily correspond directly to the number of completed or immediately available homes.


Population
Population growth remains an important driver of housing demand in Missoula County, with migration accounting for a substantial portion of recent increases. The report distinguishes between natural population growth, representing births minus deaths, and net in-migration, representing people moving into the county minus those leaving. The data show that migration has been the more significant source of growth in recent years, particularly during periods of elevated population increases. In 2024, the county recorded approximately 867 additional residents, including 719 from net in-migration and 148 from natural population growth. Although growth has moderated from earlier peaks, continued migration contributes to ongoing demand for both rental housing and homeownership.


Missoula Housing Authority Wait List
The Missoula Housing Authority’s Housing Choice Voucher program helps qualifying low-income households obtain housing in the private rental market by subsidizing the difference between an affordable tenant contribution and the rental cost. Participants generally contribute 30% of their income toward rent, with eligibility limited to households earning no more than 50% of area median income. The report shows that demand for these vouchers consistently exceeds available assistance, resulting in a large and generally increasing waiting list. The waiting-list trend highlights the continuing shortage of housing affordable to lower-income residents, even as inventory and market conditions improve for some buyers and renters.


Community Land Trust
Community Land Trusts provide an alternative pathway to affordable homeownership by separating ownership of the home from ownership of the land beneath it. Homebuyers purchase their homes while leasing the land from a nonprofit organization under a long-term agreement designed to preserve affordability for future buyers. In Missoula, three Community Land Trust homes were sold in 2025 at a median price of $257,028, and 27 homes were identified in the 2026 supply pipeline at a median price of $193,718. The report also notes that 150 Missoula households joined the Community Land Trust interest list between May and December 2025. These figures demonstrate substantial interest in permanently affordable homeownership options and the potential for land trusts to serve households priced out of the conventional market.


Vacancy Rates and Average Rents — City of Missoula
Missoula’s rental market has experienced increasing rental rates alongside fluctuating vacancy levels, reflecting changes in both housing demand and the availability of rental units. The report tracks average rents and vacancy rates across different housing types and unit sizes, including single-family houses, duplexes, and multifamily apartments. Although rents remain elevated relative to earlier years, recent vacancy fluctuations suggest that additional rental inventory has provided some relief from the exceptionally tight conditions seen previously. The report identifies vacancy rates of approximately 5%–8% as characteristic of a healthy rental market. However, conditions differ among property types and unit sizes, making it important to evaluate individual rental segments rather than relying exclusively on citywide averages.


Rental Data Collection
The report emphasizes the importance of obtaining current and comprehensive rental market information from property managers and private landlords. The Missoula Organization of REALTORS® is encouraging rental property owners and managers to participate in its 2026 rental data collection effort, which is intended to improve understanding of rental rates, vacancy conditions, and housing availability. Broader participation can help provide a more representative picture of the local rental market, particularly where smaller privately owned properties may not be fully reflected in existing data sources. Reliable rental information is important for housing policy, development planning, investment decisions, and assessing the affordability challenges facing Missoula residents.


Who’s Looking to Move to Missoula?
Online housing search data indicate that Missoula continues to attract significant interest from potential buyers outside Montana. In 2025, approximately 62.9% of the measured Realtor.com search activity originated from other states, compared with 11.1% from elsewhere in Montana and 24.4% from within Missoula. International searches accounted for approximately 1.6%. Phoenix, Arizona, represented the largest identified outside metropolitan source during the fourth quarter of 2025, followed by Denver, Colorado, and Salt Lake City, Utah. Other notable sources included Seattle, Washington, and several California communities. The geographic distribution suggests Missoula continues to attract interest from people in larger metropolitan markets, although online searches do not necessarily translate into actual relocations or purchases.


Missoula Housing Report Summary for 2025
The report concludes that Missoula’s residential housing market is continuing to stabilize following several years of unusually rapid appreciation and constrained inventory. The principal indicators include a roughly 2% decline in median sales prices, an increase in residential sales for the second consecutive year, greater use of seller concessions, and continued absorption of multifamily housing inventory. Increasing supply is helping restore more balanced conditions between buyers and sellers, although affordability challenges remain substantial, particularly for moderate- and lower-income households. Overall, the findings suggest a market undergoing gradual normalization rather than a dramatic correction, with neighborhood conditions, housing types, and price ranges continuing to influence individual market outcomes.


Overall Takeaway
The most significant finding of the 2026 Five Valleys Housing Report is that Missoula’s housing market is becoming more balanced, but it is not necessarily becoming affordable. Sales activity is improving, prices have moderated slightly, housing inventory is increasing, and sellers are offering larger concessions. However, the supply of homes affordable to typical local households remains limited, especially compared with the availability of higher-priced properties. Continued population growth, strong interest from outside markets, and persistent demand for rental assistance underscore the need for additional housing development across a broad range of price points.


Source: 2026 Five Valleys Housing Report, Missoula Organization of REALTORS®, 23-page presentation. The summaries reflect the data and conclusions presented in the report, primarily for calendar year 2025.
 

2026 five valleys housing report presentation


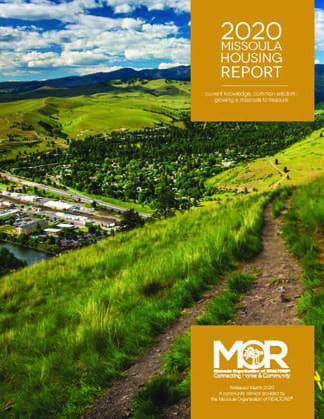
2020 Missoula Housing Report Cover
Housing Development & Occupancy
A limited supply of real estate listings, low rental vacancy rates, and limited new development (459 units total, a six-year low) in the City of Missoula is resulting in a continued trend of increased real estate prices.
 
Single-family construction projects in the City of Missoula grew in 2019, consistent with the last 10 years. However, building permits for duplexes declined and multi-family construction accounted for 197 units, similar to 2018 but 58% of the 5-year average. Missoula County permits increased slightly, accounting for 228 new units total.
 
The number of residential lots sold in the Missoula urban area declined 16 percent in 2019. The median price of those lots jumped 28.3 percent to $115,500, matching a trend of new construction homes moving into higher price categories.
 
Looking at future development, 45 new residential lots received preliminary approval in both the city and county in 2019. Meanwhile, 104 residential lots attained final plat approvals, making them ready for building in the coming year.
 
In Missoula County, approximately 58 percent of housing units are occupied by their owners. Within the city limits of Missoula, 53 percent of homes (or units) are renter occupied.
 
Population & Income
Missoula County’s population growth rose 1.1 percent in 2018, adding another 1,350 residents. In the last decade, this steady annual increase has resulted in 10,074 more people living in the area. Even with new construction, population growth puts pressure on the already constrained supply of rentals and real estate.
 
Unemployment hit a 20-year low of 3.1 percent in 2019. Missoula’s median income has improved considerably in the last two years of available data, reaching $56,598 in 2018.
 
With both rental and home prices seeing increases in 2019, home availability and affordability remain a considerable challenge for many in Missoula. A large gap exists between the median income of homeowners and that of renters, concurrently homes Missoulians can afford are becoming increasingly limited.
 
The most recent figures on poverty indicate that 13 percent of Missoula County residents live in poverty. During a single point-in-time survey of individuals experiencing homelessness, Missoula counted 367 on a single January night. Meanwhile, Missoula County Public Schools identified 419 children who had unstable housing (either experiencing homelessness or at risk of being homeless) during the 2018-19 school year.
 
Rental Housing
A tight supply of available rentals kept the vacancy rate between 2.3 and 3.7 percent for each quarter of 2019. Houses and duplexes had the tightest supply, with vacancy rates of 2 percent or less, while multiplex rentals had a better supply with a 5.1 percent annual vacancy. Rent prices increased for all types of rentals.
 
The Missoula Housing Authority (MHA) subsidized rent with 774 Section 8 vouchers in 2019, but this does not meet the demand for assistance. In 2019, they had 1,707 households sitting on the Section 8 waiting list in hopes of a voucher. In the last two years, no new rent-restricted homes came online, but MHA and Homeword have plans in the works for new homes, including for those experiencing homelessness.
 
Housing Sales & Prices
In 2019, Missoula recorded its largest increase in the median price of a home in the last decade. The median price of a home rose 8.6 percent to $315,000. The number of homes sold matched the brisk pace of the previous two years, with 1,504 sales. Data shows that home values continue to have strong appreciation in Missoula.
 
The market continued to experience a shrinking availability of homes at lower price points. Sales increased for all price points above $275,000, and homes of $500,000 or more had a 43-percent increase in sales. These changes have led to an under-supply of homes under $350,000.
 
Condominium and townhouse sales remained vigorous in 2019, which is no surprise given that their prices are often lower than a single-family starter home.
 
Housing Finance
While homebuyers may have been challenged by rising home prices in 2019, mortgage rates dropped after the Federal Reserve made a series of cuts to the fed funds rate. For the last seven months of 2019, 30-year conventional mortgage rates stayed below 4 percent.
 
Seventy percent of 2019 home sales were financed via conventional mortgages and 17 percent were cash sales, with the remaining a combination of other programs and options.
 
Rising prices mean higher down payments, but Missoula borrowers do have access to a variety of down payment assistance programs, as well as homebuyer and financial education. The financial health of the Missoula homeowner has been on the upswing for several years, with just 14 net foreclosures declared in 2019—a far cry from 2009’s 262 net foreclosures.
 
Housing Affordability
The median income of Missoula’s homeowners has increased considerably in the last few years, rising to $75,368 in 2018, with only 21 percent spending 30 percent or more of their income on housing costs.
 
The median income of Missoula renters sits at $37,538, and 48.2 percent of renters spend 30 percent or more of their income on housing—making them cost-burdened by definition.
 
To purchase a median-priced home of $315,000 in 2019, you would need an income of $98,123 (and a 5-percent down payment on a 30-yr conventional loan) to afford that home. Meanwhile, the actual median income for a 2-person household was $58,688. That disparity in real estate prices and income led to the 2019 Housing Affordability Index once again declining, indicating that a median-income household could not afford a median-priced home in Missoula.

 
Download the 2020 Missoula Housing Report


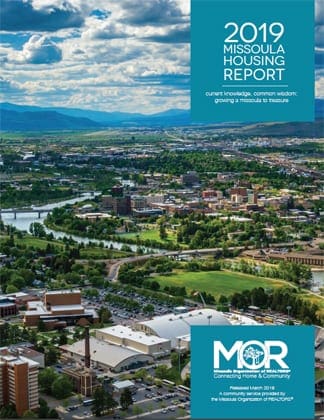
2019 Missoula Housing Report Cover
Housing Development & Occupancy
Despite a growing population, a tight supply of real estate and a relatively tight rental market, construction did not increase in Missoula in 2018.
 
Multi-family unit construction, which had enjoyed significant increases from 2016 to 2017, suddenly dropped in 2018. Within the City of Missoula, permits for new multi-family units declined 64 percent, while county permits dropped 48 percent. However, duplex permits increased and single-family permits remained relatively level.
 
Residential lot sales remained the same in 2018 as they were in 2017, with 169 lots sold. The median price was $90,000.
 
Several large, previously approved subdivisions completed development phases in 2018, raising the total number of subdivision lots that had received final approval and were ready for building up to 322. However, only 18 residential lots entered the first stage of preliminary plat approval, none of them within the city.
 
In the City of Missoula, about 46 percent of housing units are occupied by their owners; in Missoula County owners occupy approximately 58 percent of the units.
 
Population & Income
Missoula County continued to grow, adding another 1,311 residents between 2016 and 2017. While most of that growth is owed to more people moving to Missoula than moving away, net migration did see a slight decrease in 2017. Even with new rentals and single-family homes being added to the market, a growing population kept the markets for both in tight supply.
 
Economically, Missoula experienced significant improvements, although they didn’t transfer to all demographics. Unemployment reached a low of 3.8 percent in 2018, and the 2017 median income in Missoula County increased 17 percent, to $54,311. Homeowners also saw a large jump in their median income, to $75,940. Conversely, the median income for renters declined 4 percent, to $29,793. Such disparity, coupled with rising real estate prices, illustrates the difficulty many residents have in affording real estate as well as rentals.
 
As has been the case for several years, about 15 percent of Missoulians live in poverty. While the number of homeless individuals identified by a single point-in-time survey declined to 319 in January 2018, an estimated 500 children were homeless or in unstable housing during the 2017-18 school year, according to the Missoula County Public Schools.
 
Rental Housing
Missoula recorded an annual vacancy rate of 3.9 percent in 2018, which is slightly above recent years but still considered a tight rental market. Multiplexes saw a bigger increase in vacancy rates thanks to new units coming on line, but homes and duplexes had vacancy rates of 2 percent or less. Overall, rental prices declined 1.55 percent in 2018, giving renters some relief.
 
The Missoula Housing Authority (MHA) provided 774 Section 8 vouchers to subsidize rent, but it didn’t come close to meeting the demand for such assistance. With 1,777 households on their Section 8 waiting list (up 8.5 percent from 2017), it’s clear that there isn’t enough affordable housing. No new affordable housing units were added in 2018, but MHA plans to bring on 200 new units in 2020.
 
Housing Sales & Prices
The pace of home sales remained brisk in 2018 but did decline by 3.8 percent, with 1,482 homes sold. The median price of a home rose 8.1 percent, to $290,000, while that of a newly constructed singlefamily home rose 26 percent to $383,500. The largest portion of sales (32.6 percent) occurred in the $200,000 to $275,000 range, and homes over $275,000 all saw an increase in number of sales. Sales of condominiums and townhouses also kept pace, though a decline in newly constructed condominiums did cause overall condo/townhouse sales to drop by 9.6 percent in 2018.
 
The market continued its trend of having a tight supply, and competition among buyers likely contributed to rising prices. Homes under $350,000 were typically in under-supply throughout 2018.
 
Housing Finance
Home buying became more of a challenge for many would-be buyers in 2018. Higher mortgage rates drove up borrowing costs, and the cost of construction created financing issues for those looking to build. Foreclosures, however, remained low in 2018.
 
Missoula homebuyers have continued access to a number of down-payment assistance programs, as well as homebuyer and financial education. However, with such a tight supply of homes at affordable price points many buyers are unable to afford to purchase a home even with down payment assistance programs.
 
Housing Affordability
Housing affordability remains a challenge for both renters and prospective homebuyers. As the median price of a home continued to increase, the Missoula Housing Affordability Index declined. To purchase a $290,000 home in 2018 with a 5-percent down payment, a family would have needed an income of at least $95,731 to have it considered affordable.
 
While the percentage of homeowners spending a worrisome portion of their income on housing decreased to 22 percent in Missoula, according to the most recent 2017 data, the number of renters spending more than 30 percent of their income on housing increased, reaching almost 49 percent.

 
Download the 2019 Missoula Housing Report


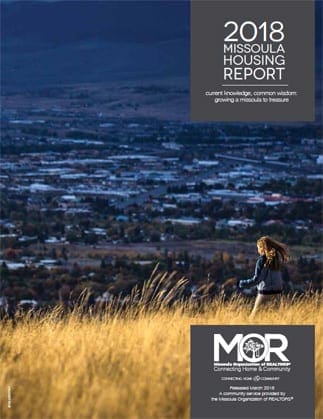
Cover Page Image, 2018 Missoula Housing ReportEXECUTIVE SUMMARY


Housing Development & Occupancy


Missoula’s growing population, along with a tight rental market and tight real estate supply, spurred an increase in construction in 2017. Residential lot sales rang in with 169 lots being sold in 2017, marking the third year in a row of high lot sales. The median price of those lots increased 8.1 percent in 2017, to $92,500.


Building permits within the City of Missoula remained high for the second year in a row, with a total of 758 units permitted. At the county level, single-family building permits increased by 25 percent in 2017 and multi-family units increased by 162 percent over the previous year. However, according to US Census Bureau estimates, county-wide growth in the housing stock lagged slightly behind growth in the number of households between 2010 and 2016.


The number of Townhome Exemption Development units permitted also increased in the city. In addition, after three years of relative inactivity, Missoula saw a substantial increase in the number of preliminary plat approvals for subdivisions.


In the City of Missoula, about 46 percent of housing units are occupied by their owners; in Missoula County, owners occupy about 57 percent of the units.


Population and Income


Missoula County reached a population of 116,130 in 2016, a 1.7 percent increase from the previous year. Net migration has driven this recent growth, increasing 86 percent from 2015 to 2016, indicating that a much higher proportion of people are moving to Missoula than are moving away. This has placed increasing pressure on the housing supply.


While Missoula boasts a relatively low unemployment rate, the median income in Missoula County in 2016 was $46,550, which is below the Montana and U.S. median income. However, Missoula homeowners had a median income of $64,612 while Missoula renters came in at less than half of that, with a median income of $31,146. Such numbers highlight the difficulty that many residents have in affording both rental and real estate prices.


The percentage of Missoulians living in poverty continues to hover around 16 percent. The number of homeless individuals identified by a single point-in-time survey in January 2017 was 344, which was down slightly from 2016; however, the Missoula County Public Schools estimate that 438 children were homeless or in unstable housing during the 2016-2017 school year.


Rental Housing


Missoula continued to encounter low vacancy rates for rentals in 2017, with an average vacancy rate of just 3.0 percent. Certain types of rentals experienced rent increases of up to 5 and 6 percent for three- and four-bedroom units, while other rents increased by less than 2 percent.


The Missoula Housing Authority was able to support all 774 of its Section 8 vouchers, which subsidize rent, but the demand for this rental assistance greatly exceeds the supply. They still had 1,637 households on a waitlist for Section 8 vouchers in 2017.


Housing Sales & Prices


In 2017 Missoula experienced its most active year of home sales on record, with 1,543 homes sold. Of those, 39 percent were priced between $200,000 and $275,000—a price range that was considered in under supply according to the market absorption rates.


With a tight supply and competition among buyers, the median price of a home in Missoula increased 5.2 percent to $268,250 in 2017. Sales of homes under $200,000 declined by 26 percent, indicating a shrinking availability of more affordable homes. Meanwhile, sales of condominiums and townhouses, which often provide a more affordable option for buyers, increased by 29 percent in 2017.


New construction sales also hit a high in 2017, with 191 units sold, a 59 percent increase from 2017.


Housing Finance


Mortgage rates remained affordable in 2017, with a year-end interest rate of 4.0 percent. However, student loan debt has been a hurdle for many borrowers. While conventional loan programs have changed the way they calculate this debt, the FHA and USDA Rural Development loans have not. Approximately 69 percent of 2017 buyers used a conventional loan.


When it comes to down payments, Missoula homebuyers have access to a number of down payment assistance programs, as well as homebuyer and financial education. The good news is that home mortgage foreclosures dropped to a 10-year low, with just 24 properties reaching foreclosure in 2017.


Housing Affordability


Housing affordability remains an issue for both renters and prospective homebuyers. The Missoula Housing Affordability Index increased slightly in 2017, after several years of decline. But it still remains that a household would need a median income of $84,038 to afford a median-priced home with a 5-percent down payment in 2017. With a 20 percent down payment, one would need a household income of $65,949.


In both 2015 and 2016 (which have the most recent available data), approximately 47 percent of Missoula renters spent more than 30 percent of their income on housing, which put them in the “cost burdened” category of being likely to have a hard time meeting other financial obligations. Comparatively, Missoula homeowners appear to be less cost burdened, with 25 percent of homeowners spending more than 30 percent of their income on housing costs in 2016.


Download the 2018 Missoula Housing Report


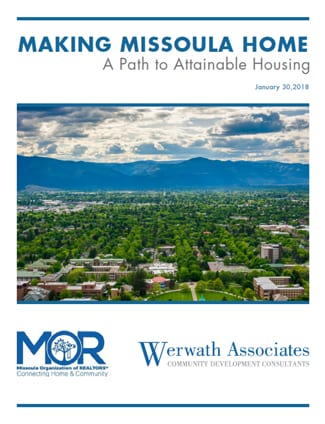
Making Missoula Home Cover Page - 2018Recognizing the growing issues of housing affordability facing the greater Missoula area, in the winter of 2016-2017 the Missoula Organization of REALTORS® began assembling both private and public-sector partners towards the goal of commissioning a study to analyze the housing market conditions and provide recommendations for strategies to promote more housing affordability.


In March 2017, Werwath associates was retained to collect data and research that characterized the demographic and housing market conditions, analyze the current state of housing affordability, survey both housing consumers and the building industry, analyze both regulatory and no-regulatory housing development constraints, and to provide concise recommendations for new strategies to increase housing affordability.


The process of compiling this report included a deep review of housing, workforce, and demographic information from the Census and local sources, over 30 stakeholder interviews (see Appendix I for a complete list), a review of housing market and housing development cost data, as well as a review of key regulations impacting housing development for both the City of Missoula and Missoula County.


The process of compiling this report was overseen by a diverse advisory group that included representatives from the city, county, building industry, REALTORS®, lenders, local businesses, and planning/engineering fields who met four times throughout the process of drafting the report to provide feedback on report drafts as well as to provide overall feedback on the approach and direction of the project. In addition, the drafts were reviewed by affordable housing service providers including the Missoula Housing Authority, Homeword, and NeighborWorks Montana, who provided invaluable feedback. There was also broad community and industry support for this project, and continued support around implementation is what will be required to create systems-level change in the various areas that impact housing affordability.


This project would not be possible without the direct support of our project partners including the City of Missoula, Missoula County, the Missoula Area Chamber of Commerce, Missoula Building Industry Association, and the Missoula Economic Partnership. Additional sponsorship support was provided by First Security Bank, Edgell Building, Pew Construction, Territorial LandWorks, St. Patrick Hospital, First Interstate Bank, the National Association of REALTORS®, and the Montana Association of REALTORS®. We would also like to recognize the time and valuable input volunteered by our advisory group members: Collin Bangs, Clint Burson, David Edgell, Janna Geier, James Grunke, Ruth Hackney, Scott Hansen, John Horner, Merry Hutton, Mike Nugent, Pat O’Herren, Eran Pehan, Tom Pew, Jason Rice, Nicole Rush, Sam Sill, and DJ Smith.


Download the Making Missoula Home report